Google have retired Google Universal and switched to Google Analytics 4, and with this change, methodology changed for additive and non-additive measures - namely, the Users, New Users, and Sessions metrics. When analysing data from the Traffic table of Google Analytics data, the following steps will need to be taken.
To support the performance of reporting and analysis with fixed periods (eg Week 4 2024), tRS have set up a dimension in your Google Analytics Traffic Sources table of your cube called "Reporting Level".

You will need to add this filter into your pivots and portal reporting for speed of reporting and to support anywhere you are analysing GA New Users, GA Users and GA Sessions in Google Analytics Traffic Sources.
Using the following pivot as an example, Reporting Level is added to the filter area and the filter is set to "Total". This allows you to view the data contained within the non-additive measures.
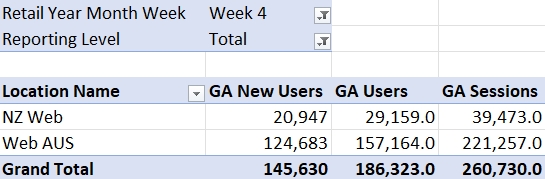
For standard analysis, select "Total". This will show all Traffic data for the other filters and dimensions you have added to your report. If you would like to conduct analysis on a more specific level, you may choose another option from the list.

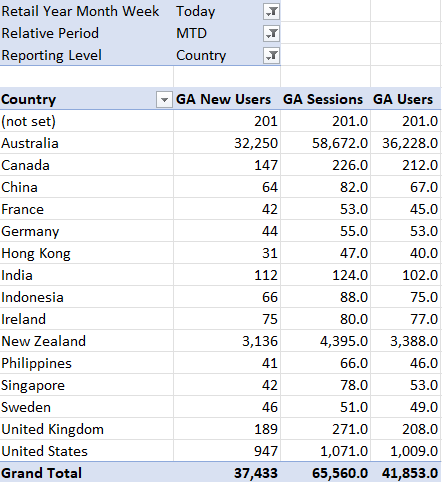
If you do desire to drill down to a different level of analysis, ensure the Reporting Level filter you have selected aligns with the rows or columns you have added to your pivot.
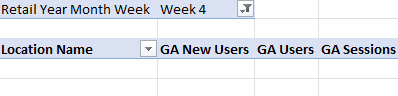
If you do not select a reporting level, are using multiple or conflicting reporting levels, or if you select the default "All", you will not see any data in your pivot:
In the Portal, the same filter has been added to your page filters. You will use this in the same way you would in the pivots, as described above. The default is set to "Total".
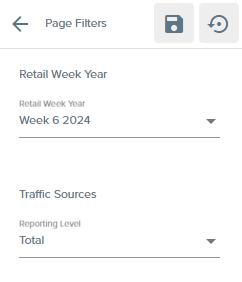
Open the Reporting Level filter, and choose the option you would like to see your data analysed by.

You must ensure that you only have one option selected in the filter on the portal, as due to these measures' non-additive nature, you cannot combine multiple options into one number.
Once you have added this filter to your pivots or your portal, you can conduct analysis as you normally would.