Important: The analysis filter only works for the Product Gallery.
Functionality
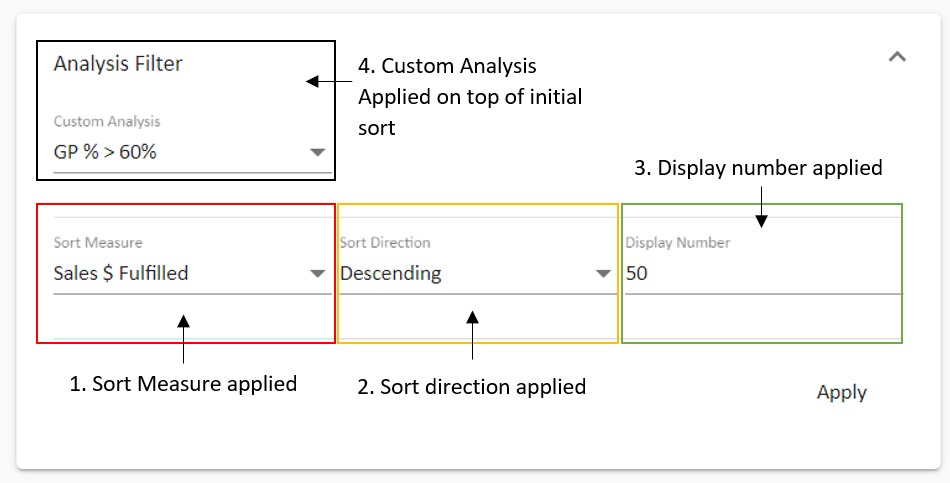
- The analysis filter allows a user to, in order:
- 1. Apply a custom sort (eg Sales $ Fulfilled),
- 2. The direction of that sort (is it ascending or descending?)
- 3. Set a number of items to be displayed (eg Top 50)
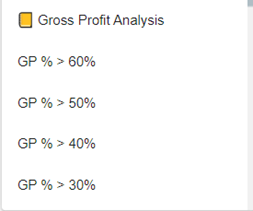
- 4. Apply a custom analysis lens on top of that initial sort (eg GP% > 60%)
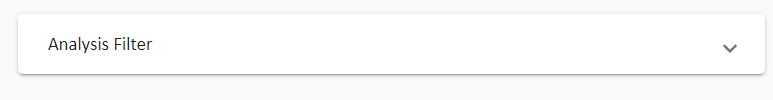
Hidden
Expanded
Note: The Sort Measure, Direction, and Number is simple and easy to apply. If you need more measures to sort with, you can log a ticket to support@theretailscore.com
Custom Analysis Functionality
- The custom analysis functionality allows a user to apply a further lens on their initial sort.
- I for instance could combine: GP % < 50% | Sales Units > 1 | CSOH > 1 into one Custom Sort Measure.
Note:
- We can only sort with measures from the cube.
- We can only do the following comparisons:
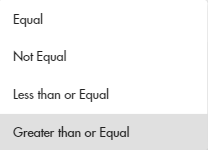
- We can only compare to a fixed value (ie 1,2,3..... or 1%, 2%, 3%.....)
- We cannot compare to other values (eg Sales $ > Sales $ LY)
- For custom sorts to be applied please log a ticket to support@theretailscore.com
Examples:
Single-Layer Compare Multi-Layer Compare